How to Use the Success Tutoring Territory Map to Research a Tutoring Franchise Area
A walkthrough of the Success Tutoring franchise territory map: what the colours mean, the demographic and school data behind each territory, and how to use it for your own research before applying.

By Michael Black
Founder & Global CEO
If you are thinking about a tutoring franchise, one of the first questions is simple: where could I actually open? Success Tutoring publishes an interactive territory map so you can answer that yourself. In the short video below, our team walks through how the map works, what the colours mean and what data sits behind each territory. This article expands on the video for anyone who wants to research an area before starting a conversation with us.
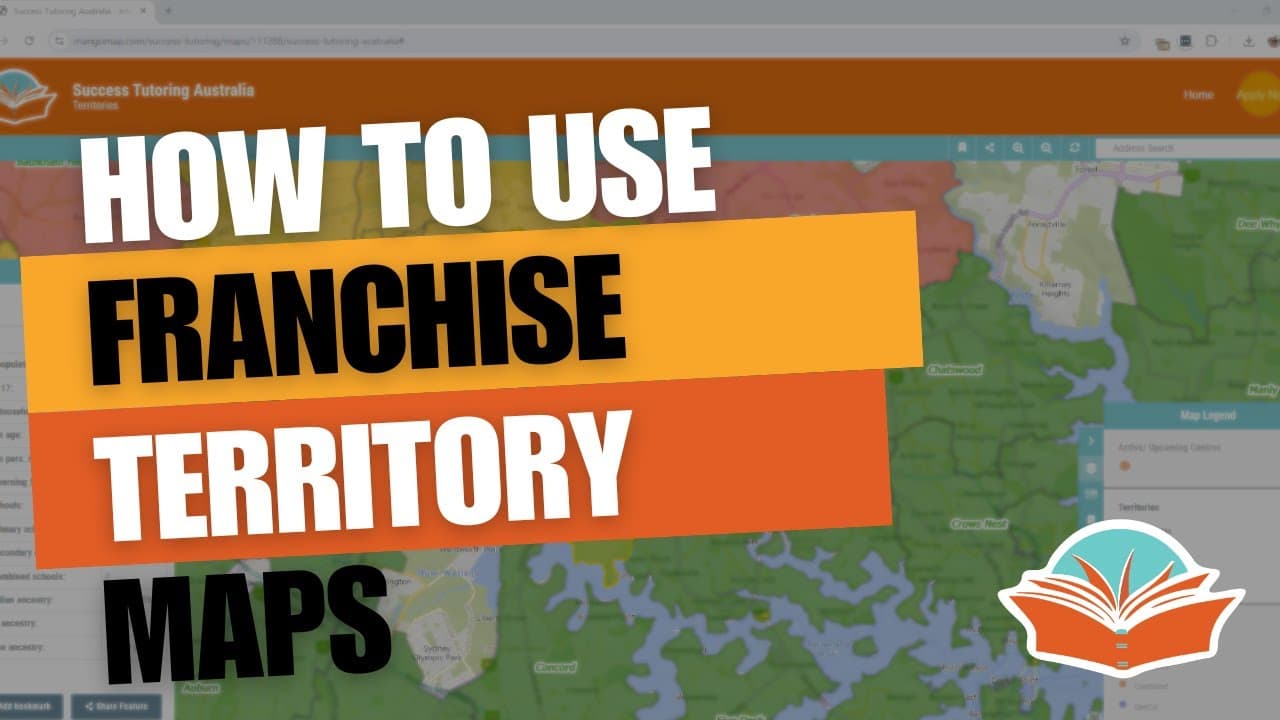

What the territory map is for
The map exists so you can do your own homework. As the presenter puts it in the video, "the main purpose of this territory map is to allow you to check where there are available territories and what the characteristics of that territory are in terms of demographics, the number of schools in the area and so forth."
That matters because choosing a territory is one of the biggest decisions you make when buying any franchise. A centre-based tutoring business serves families who live nearby, so the make-up of the local community, the number of school-age children and the schools in the area are all worth understanding before you commit time and money to the process.
The map is national. When you open it you will see Australia with the capital cities, including Perth, Melbourne, Sydney and Brisbane, and you can zoom into any region to see the individual territories drawn across it.
Step 1: Read the colours
Once you zoom into a city, the territories appear as shaded areas. The colours show availability:
- Green territories are available.
- Orange and red territories are either reserved or sold.
If you are looking for somewhere to open, start by exploring the green areas near where you live or would like to work. A territory that is reserved or sold is not available on the map, but it is still worth asking us about nearby areas, since availability changes over time.
Step 2: Click a territory to see its demographic summary
Clicking on any territory opens a summary panel. In the video, the presenter clicks on a territory in Sydney to show the kind of information you will see, which includes:
- Total population of the territory
- The number of people aged 5 to 17
- The number of households
- Median age
- Median income
- The number of people earning over $2,000 per week (about $104,000 a year)
The 5 to 17 age group is the one most directly relevant to a K-12 tutoring business, because it approximates the school-age population. Household numbers and income measures help you understand the wider community you would be serving.
Step 3: Look at the schools in the area
Below the demographic summary is information on local schools: the total number of schools, and how many are primary, secondary and combined schools.
You can also switch on a schools overlay. "We can also visualise those schools on the map as an overlay," the presenter explains, "so those dots on the map are the schools themselves." This is a practical way to see where schools cluster within a territory, which can help you think about where a retail-style learning centre might sit and how families move around the area. For more on choosing a site, read our guide to picking a tutoring centre location.
Step 4: Review the community profile
The final section of each summary shows ancestry information, such as Australian, Indian and Chinese ancestry, both as a raw count and as a percentage of the territory's population.
This helps you build a picture of the community. Different communities may have different expectations of education and tutoring, and understanding that can shape how you would approach local marketing and relationships with families.
Where the data comes from
According to the video, the demographic data on the map comes from the latest Australian census, counted for the households inside each territory's boundary. Because the boundary is drawn on the map, you can see exactly which area the figures describe.
The presenter also notes that territories are designed to be broadly similar in size, while acknowledging that "of course there are slight differences between them." That is one reason to compare several territories rather than looking at just one. Our article on how franchise territories work explains more about how franchisors draw territories and why the map is only part of the picture.
What the map does not tell you
The territory map is a research tool, not a contract. It shows availability and demographic data, but the rights that attach to any particular territory are set out in the franchise agreement and disclosure documents, not on the map. Neighbouring territories exist, as the presenter points out, and you should read and understand exactly what the documents say about your area, ideally with a franchise lawyer.
Census data also describes people, not demand. A territory with a large school-age population is not automatically a good business, and a smaller one is not automatically a poor one. Results depend on many factors, including the site you lease, local competition, how you run the centre and how you build relationships with families. Nothing on the map is a forecast of how a centre in that area will perform.
Practical tips for using the map
- Start broad, then narrow. Look at a whole city first, then shortlist two or three green territories that you would realistically be able to run day to day.
- Compare like with like. Put the 5 to 17 population, household numbers and school counts for your shortlisted territories side by side.
- Use the school overlay. Note where schools cluster and where the main shopping strips or retail centres are.
- Visit in person. Drive the territory at school pick-up time and on a weekend. The data tells you who lives there; a visit tells you how the area works.
- Write down your questions. Bring them to your first conversation with our team, and ask how the territory is defined in the documents.
When you are ready, there is an Apply Now button in the top right of the map that takes you to the Success Tutoring application page.
Frequently asked questions
Where can I find the Success Tutoring territory map?
The live map is at apply.successtutoringfranchise.com. You can also see territories by region on our franchise territories page and on our state and city tutoring franchise pages.
What do the colours on the territory map mean?
Green territories are available. Orange and red territories are either reserved or sold. Availability can change, so if an area you are interested in is not green, it is still worth asking about nearby options.
Where does the territory data come from?
The video explains that the demographic information comes from the latest Australian census, counted for the households within each territory's boundary. School information covers the primary, secondary and combined schools located in the territory.
Does the map show what rights I would have in a territory?
No. The map shows availability and demographic data only. The specific rights attached to a territory are set out in the franchise agreement and disclosure documents you receive during the process, and you should have them reviewed by a franchise lawyer before signing.
Next steps
The territory map is the easiest place to start researching a tutoring franchise in your area. Explore the live map, browse our franchise territories and tutoring franchise locations by state and city, and then read the process to see how a territory enquiry moves through to disclosure documents and a decision.

By Michael Black
Related Resources

Why a Teacher Brought a Tutoring Franchise to New Zealand: Tom's Story at Success Tutoring Northwest
Tom, franchise partner of Success Tutoring Northwest, the first Success Tutoring centre in New Zealand, explains how teaching, legal and business experience led him to open a tutoring franchise.

From New Parent to First-Time Business Owner: A Tutoring Franchise Partner's Story
A Success Tutoring franchise partner shares why the birth of their first child, and years spent around education, led them to open their own tutoring centre with no prior business experience.

From Electrical Engineer to Success Tutoring Franchise Partner: Thomas's Story
Thomas spent more than 20 years as an electrical engineer and project manager. Now he runs a Success Tutoring centre in Brisbane alongside a part-time engineering role. Here is why he made the move and what his days look like.